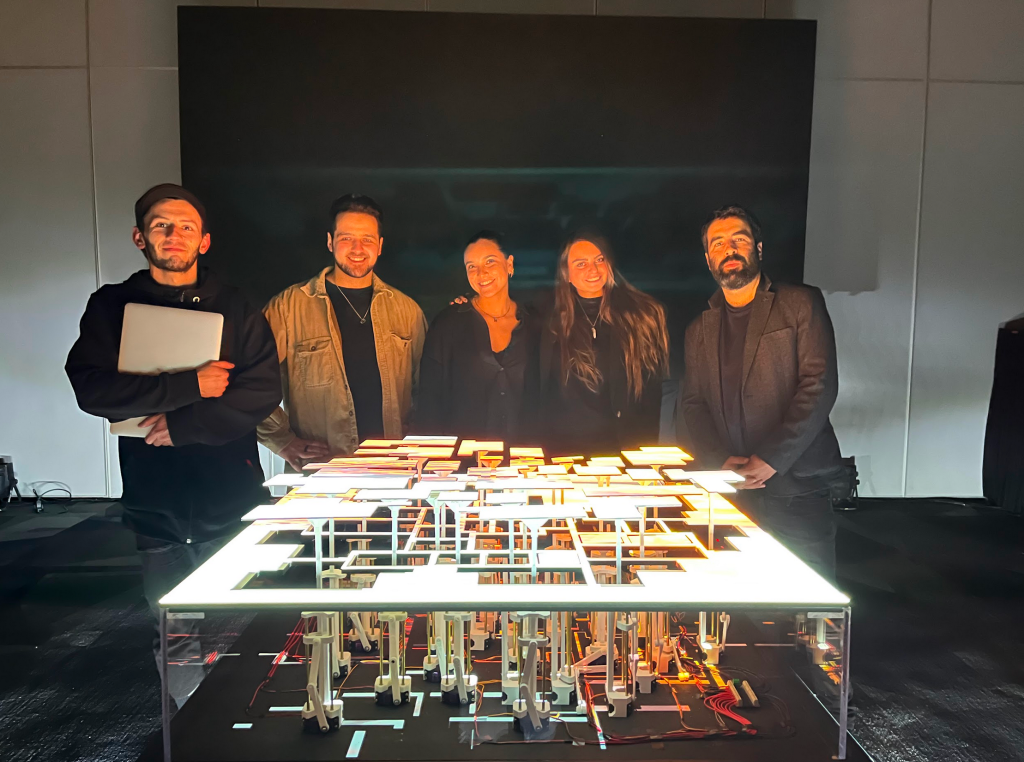
ExploraTec UDD, in collaboration with students and teachers from the Design and Engineering majors, has developed an innovative project that seeks to visualize data from a specific region to identify valuable insights from them. This project, called FIM, has an interactive projection of data created in Processing that is aligned with a physical model that uses servo motors to move mechanical parts according to the information presented.
This project began within the Integrated Workshop of the Faculty of Design, in charge of the teachers Nicolas Parraguez and Osvaldo Zorzano. This workshop was focused on visualizing data. FIM was then taken to ExploraTec UDD for its development and presentation at the FABRIC CHILE event of the multinational SIEMENS. The initiative took a semester to create and a full year for its subsequent development and seeks to provide a useful tool to identify problems in a specific region, city or commune.


The version presented in FABRIC CHILE focused on the city of Santiago de Chile, separated by communes, showing demographic data on population growth and electricity consumption of each commune. This tool can be very useful for municipalities, since it allows a clear visualization of data to identify problems and opportunities.
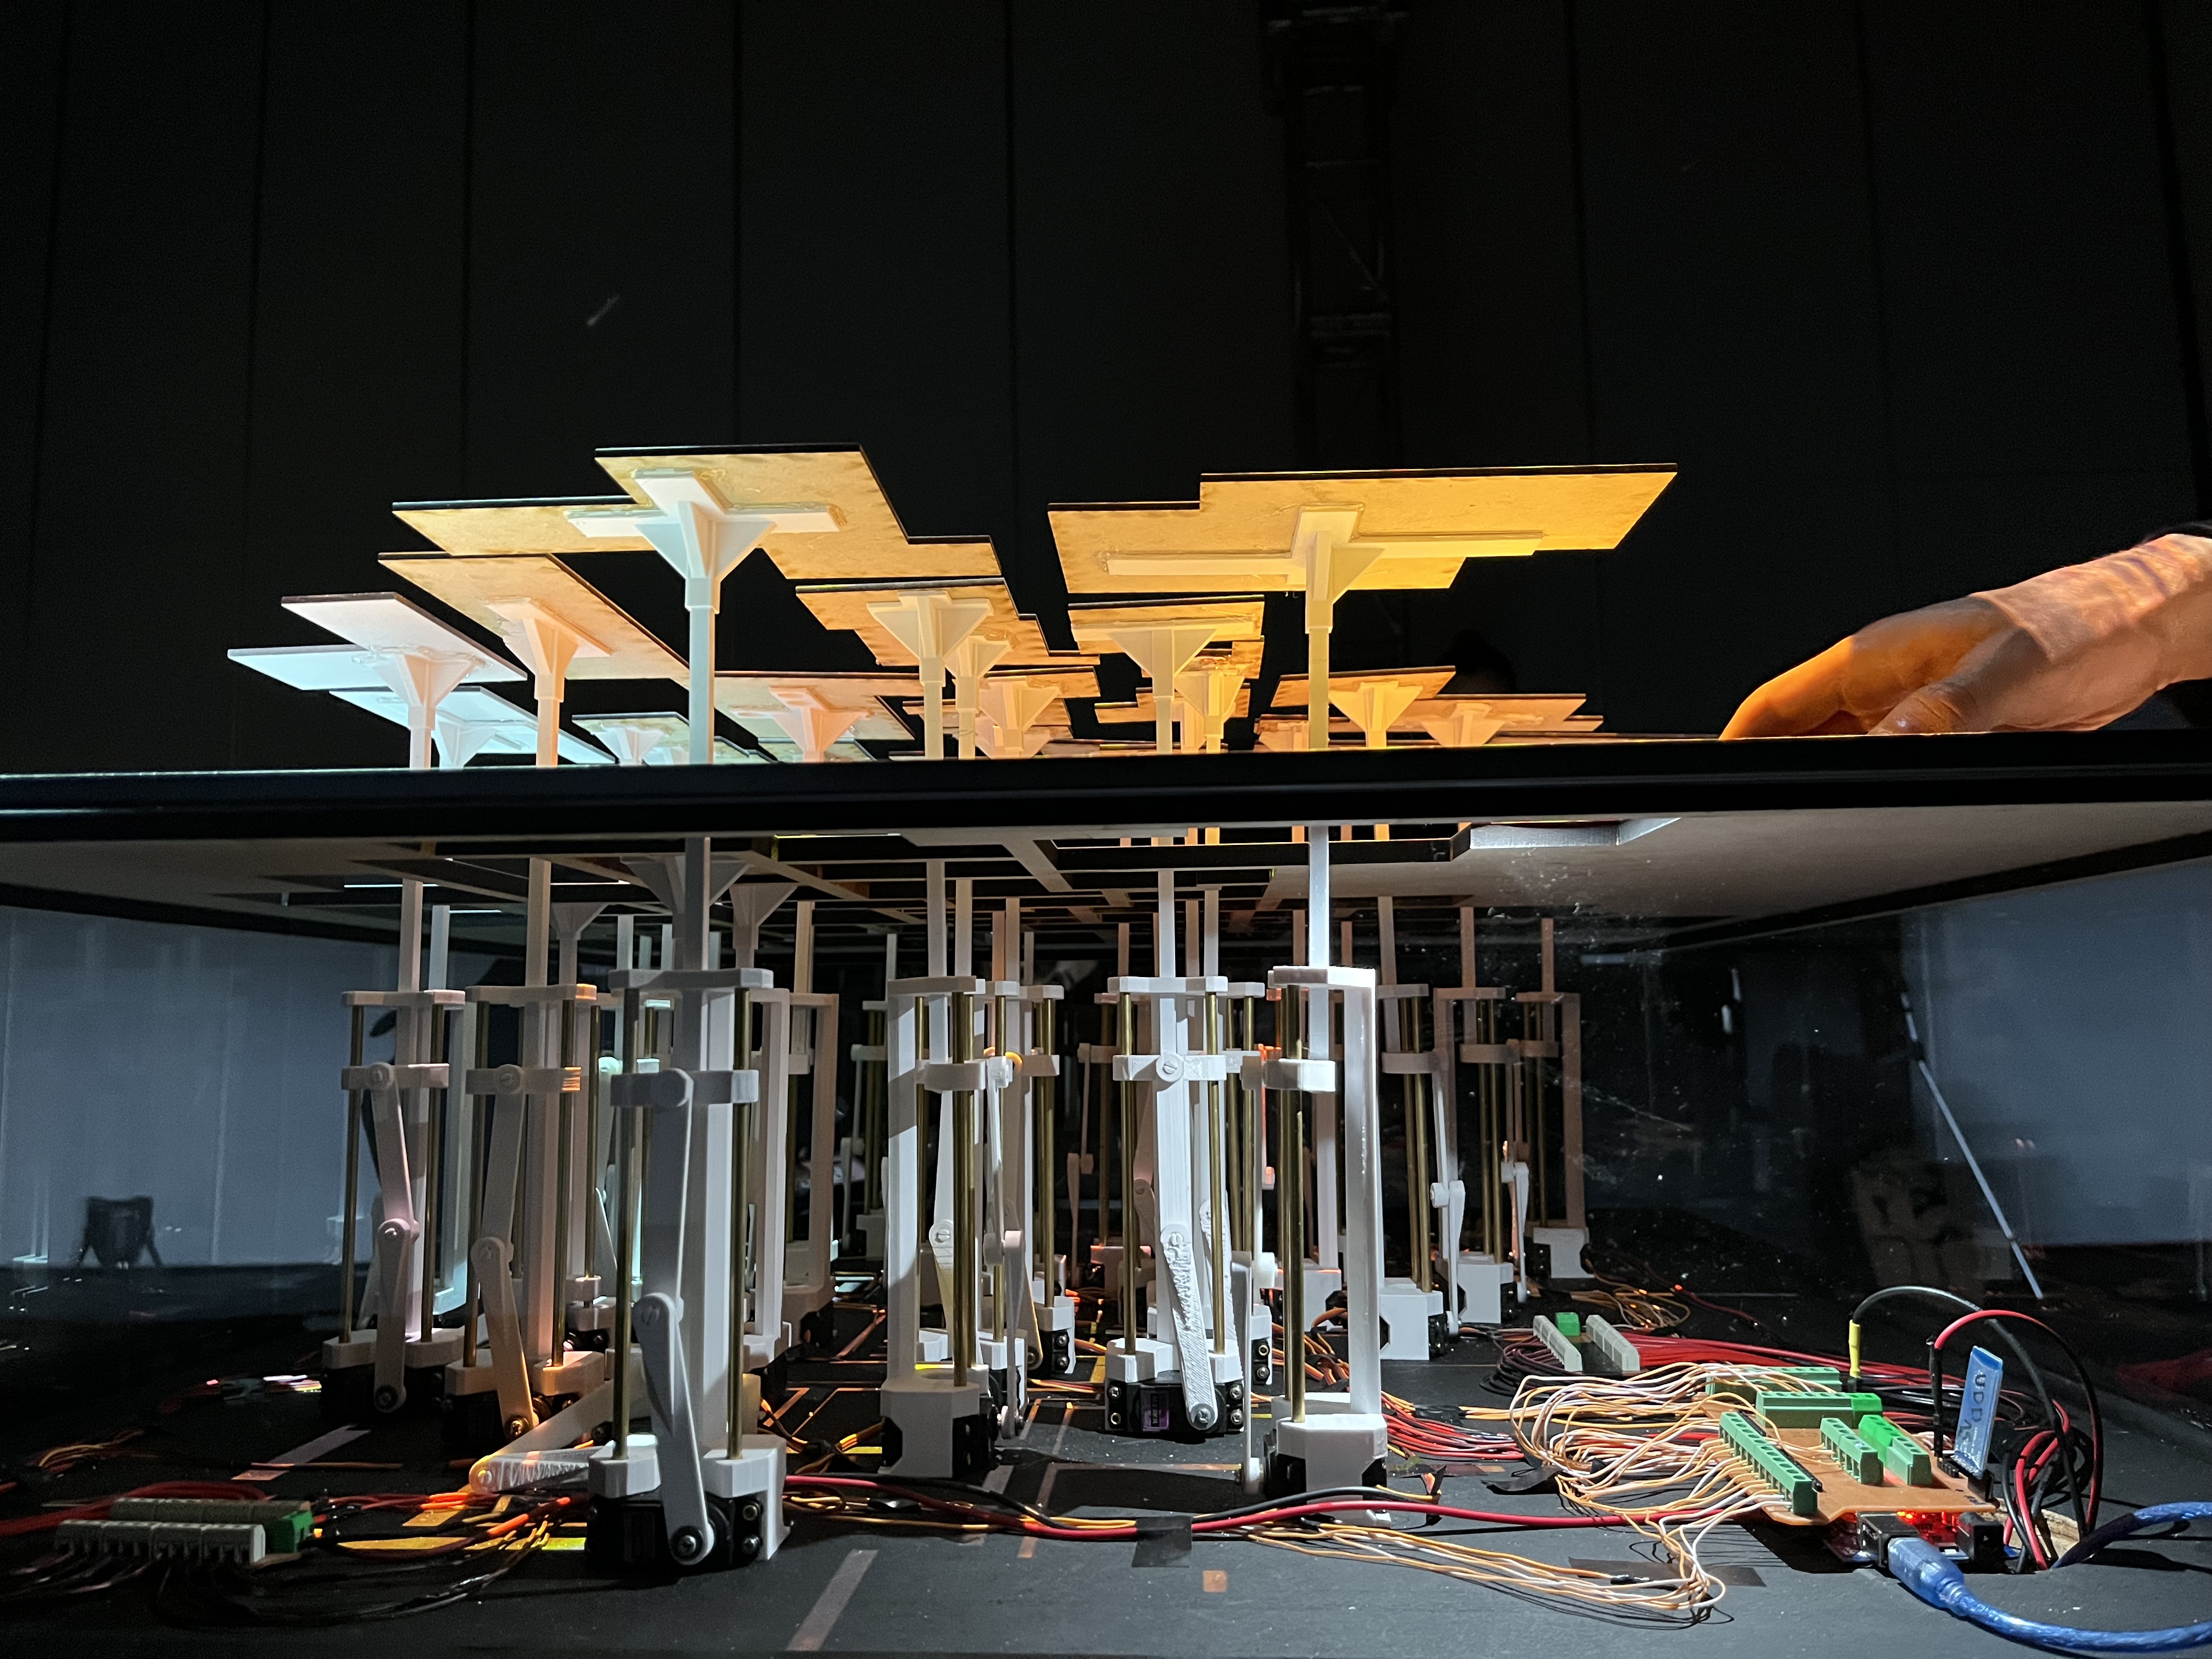
One of the biggest technical challenges of this project was the coordination of more than 30 motors controlled by a single application, connected to a projection that displays the data in a dynamic and effective way. However, the results have been very successful and the project has received great attention from members of the Universidad del Desarrollo community.
The visualization consists of a projection that is aligned with the model, showing animated particles that represent the energy consumption and population growth of each region. The model is a map of the Santiago region with each commune separately controlled by a motor, which raises the commune from the model surface to represent the population growth data and aligns with the digital projection. Every time the year is changed, what is projected on the model changes and the communes move on the vertical axis depending on the growth of that year.
FIM offers a didactic way of visualizing problems in the different regions, which makes it a useful tool for the government and municipalities throughout the country. In addition, its use in academic projects with the Faculties of Design and Engineering and with the Municipality of La Reina makes it an initiative with great potential for positive impact.
Siemens Fabric Chile 2022


Tech Development


Conceptual Images


Plan


